Home > Investor Relations > IR Library > Financial Highlights/Earnings and Dividends Forecasts
Financial Highlights/Earnings and Dividends Forecasts
See Financial Results for the latest “Summary of Financial Results, Selected Financial Information”
- Annual
- Results of Operations
- Breakdown of Net Fees and Commissions
- Financial Conditions
- Asset Management Status
- Capital Adequacy Ratio
- Dividends(1)
- Dividends(2)
- Quarterly
- Results of Operations
- Breakdown of Net Fees and Commissions
- Financial Conditions
- Asset Management Status
- Capital Adequacy Ratio
- Earnings and Dividends Forecasts
- Earnings Forecasts
- Dividends Forecast
(Annual)
Results of OperationsConsolidated
FY2025/3
Net interest income for the fiscal year ended March 31, 2025 increased by \240.9 bn year on year, mainly due to increases in income related to foreign bonds investment trusts, interest on Japanese government bonds and interest on Bank of Japan deposits.
Net fees and commissions increased by \3.3 bn year on year.
Net other operating income increased by \67.6 bn year on year, due to increases in gains (losses) on foreign exchanges and gains (losses) on bonds.
General and administrative expenses decreased by \13.4 bn year on year.
Net ordinary income increased by \88.4 bn year on year.
Net income attributable to owners of parent increased by \58.1 bn year on year to \414.3 bn, which was record high profits in our history as a listed company for the second consecutive fiscal year.

| FY2020/3 | FY2021/3 | FY2022/3 | FY2023/3 | FY2024/3 | FY2025/3 | |
|---|---|---|---|---|---|---|
Consolidated gross operating profit |
1,314.0 | 1,319.1 | 1,292.0 | 1,056.3 | 733.6 | 1,045.6 |
General and administrative expenses* |
1,021.5 | 1,011.4 | 983.2 | 926.3 | 929.1 | 915.6 |
Net ordinary income |
379.1 | 394.2 | 490.8 | 455.5 | 496.0 | 584.5 |
Net income attributable to owners of parent |
273.4 | 280.1 | 355.0 | 325.0 | 356.1 | 414.3 |
Net interest income |
976.6 | 961.9 | 1,147.4 | 796.3 | 715.7 | 956.7 |
Net fees and commissions |
128.8 | 127.9 | 128.4 | 147.8 | 153.0 | 156.3 |
Net other operating income (loss) |
208.4 | 229.1 | 16.0 | 112.1 | (135.1) | (67.4) |
ROE (based on shareholders’ equity)(%)** |
3.03 | 3.06 | 3.80 | 3.44 | 3.74 | 4.28 |
* General and administrative expenses exclude non-recurring losses.
** ROE = net income attributable to owners of parent / [(sum of total net assets at the beginning and the end of the period) / 2] x 100
Breakdown of Net Fees and CommissionsNon-consolidated
FY2025/3
Net fees and commissions for the fiscal year ended March 31, 2025 increased by \3.3 bn year on year to \154.8 bn.
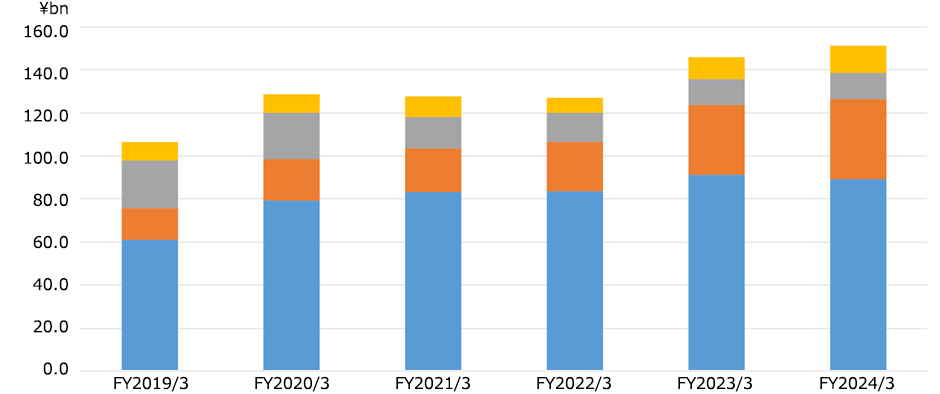
| FY2020/3 | FY2021/3 | FY2022/3 | FY2023/3 | FY2024/3 | FY2025/3 | |
|---|---|---|---|---|---|---|
Others |
8.5 | 9.7 | 7.2 | 10.4 | 12.7 | 13.8 |
Investment trusts* |
21.7 | 14.6 | 13.6 | 11.8 | 12.2 | 13.0 |
ATMs |
19.0 | 20.1 | 22.7 | 32.8 | 37.3 | 38.1 |
Exchange and settlement transactions |
79.4 | 83.4 | 83.7 | 91.1 | 89.2 | 89.8 |
* Since FY2023/3, Investment trusts include Yucho Fund Wraps (discretionary investment contract services).
Financial ConditionsNon-consolidated
FY2025/3
Total assets were \233.5 tn as of March 31, 2025.
As of March 31, 2025, Deposits were \190.4 tn, Liquid deposits were \125.9 tn, Fixed-term deposits were \64.3 tn.
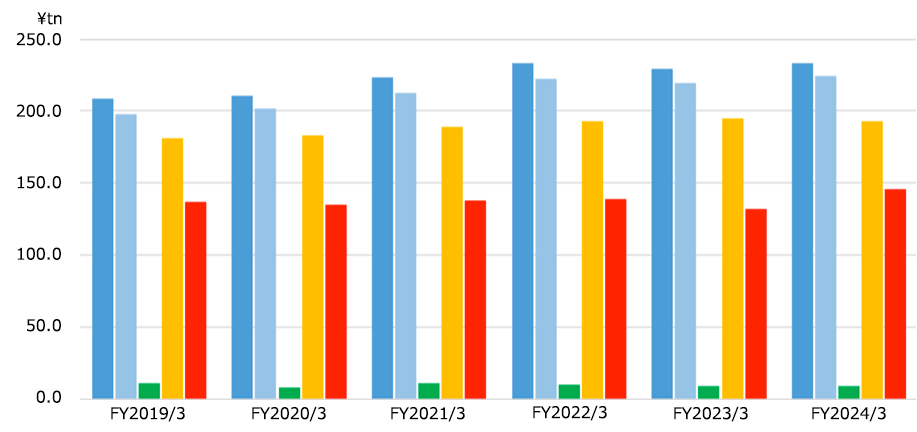
| FY2020/3 | FY2021/3 | FY2022/3 | FY2023/3 | FY2024/3 | FY2025/3 | |
|---|---|---|---|---|---|---|
Total assets |
210.9 | 223.8 | 232.9 | 229.5 | 233.8 | 233.5 |
Total liabilities |
201.9 | 212.4 | 222.6 | 219.9 | 224.1 | 224.5 |
Total net assets |
8.9 | 11.3 | 10.2 | 9.6 | 9.6 | 9.0 |
Deposits |
183.0 | 189.5 | 193.4 | 194.9 | 192.8 | 190.4 |
Securities |
135.1 | 138.1 | 139.5 | 132.7 | 146.4 | 143.5 |
Asset Management StatusNon-consolidated
FY2025/3
Included in investment assets as of March 31, 2025, JGBs were \40.3 tn and foreign securities, etc. were \87.4 tn.
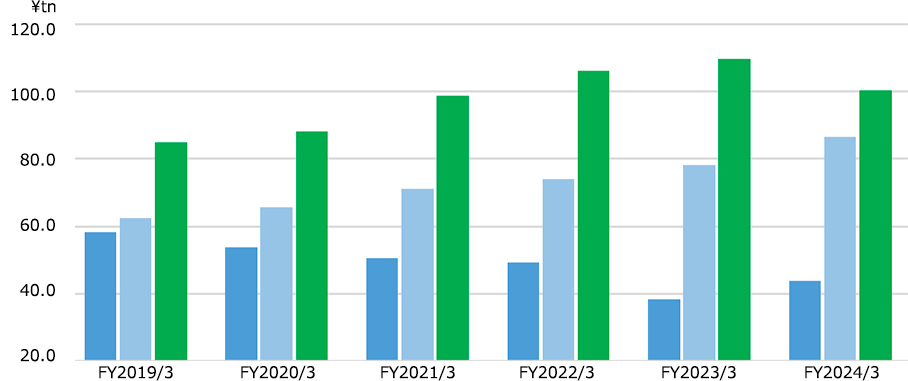
| FY2020/3 | FY2021/3 | FY2022/3 | FY2023/3 | FY2024/3 | FY2025/3 | |
|---|---|---|---|---|---|---|
Japanese government bonds |
53.6 | 50.4 | 49.2 | 38.1 | 43.8 | 40.3 |
Foreign securities, etc. |
65.6 | 71.1 | 74.1 | 78.3 | 86.6 | 87.4 |
Others |
88.2 | 98.9 | 106.2 | 109.9 | 100.5 | 102.4 |
Capital Adequacy RatioConsolidated
FY2025/3
Capital adequacy ratio (domestic standard) was 15.08% as of March 31, 2025.
(Reference) Common Equity Tier1 capital ratio (international standard, estimate) was 11.77%.
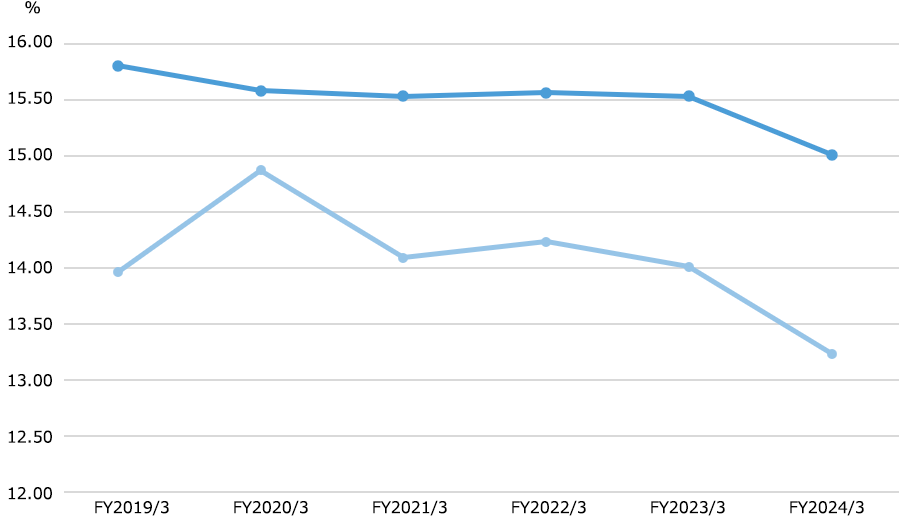
| FY2020/3 | FY2021/3 | FY2022/3 | FY2023/3 | FY2024/3 | FY2025/3 | |
|---|---|---|---|---|---|---|
Capital adequacy ratio (Domestic standard)* |
15.58 | 15.53 | 15.56 | 15.53 | 15.01 | 15.08 |
CET1 ratio (International standard)** |
14.87 | 14.09 | 14.23 | 14.01 | 13.23 | 11.77 |
* The figure as of March 31, 2025 is on the finalized Basel Ⅲ basis.
** Excluding unrealized gains on available-for-sale securities. Calculation for some items are simplified. Since March 31, 2024, the CET1 ratios are on the finalized Basel Ⅲ basis.
Dividends(1)Consolidated
FY2025/3
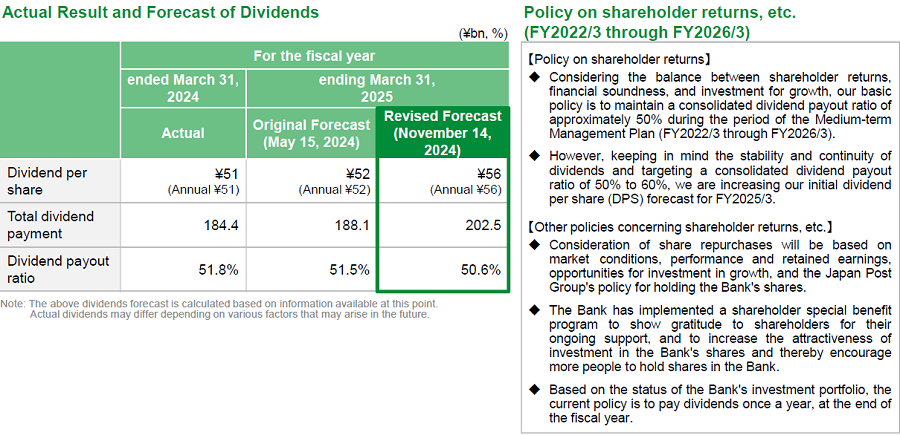
Dividend per share for the fiscal year ended March 31, 2025 is \58, an increase of \2 from the revised-upward dividend forecast announced on November 14, 2024.
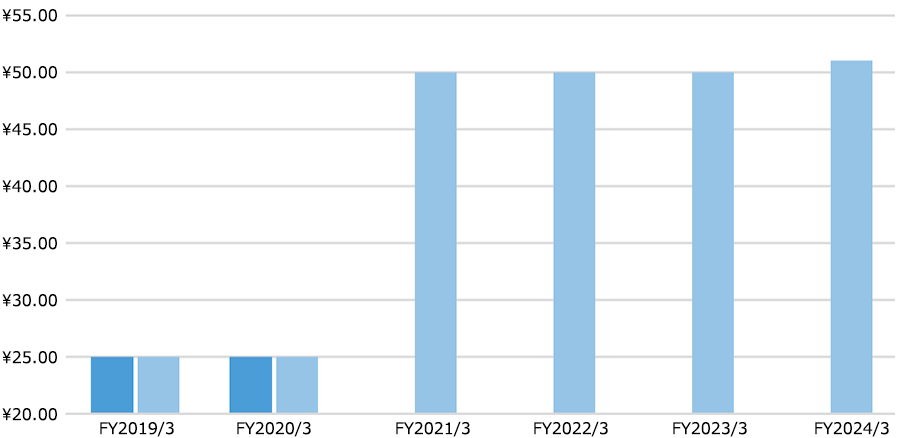
| FY2020/3 | FY2021/3 | FY2022/3 | FY2023/3 | FY2024/3 | FY2025/3 | |
|---|---|---|---|---|---|---|
Dividends per share(As of Sept. 30) |
¥25.00 | ¥0.00 | ¥0.00 | ¥0.00 | ¥0.00 | ¥0.00 |
Dividends per share(As of Mar. 31) |
¥25.00 | ¥50.00 | ¥50.00 | ¥50.00 | ¥51.00 | ¥58.00 |
Dividends(2)Consolidated
FY2025/3
Total dividend payment for the fiscal year ended March 31, 2025 is \208.8 bn.
Dividend payout ratio for the fiscal year ended March 31, 2025 is 50.6%.
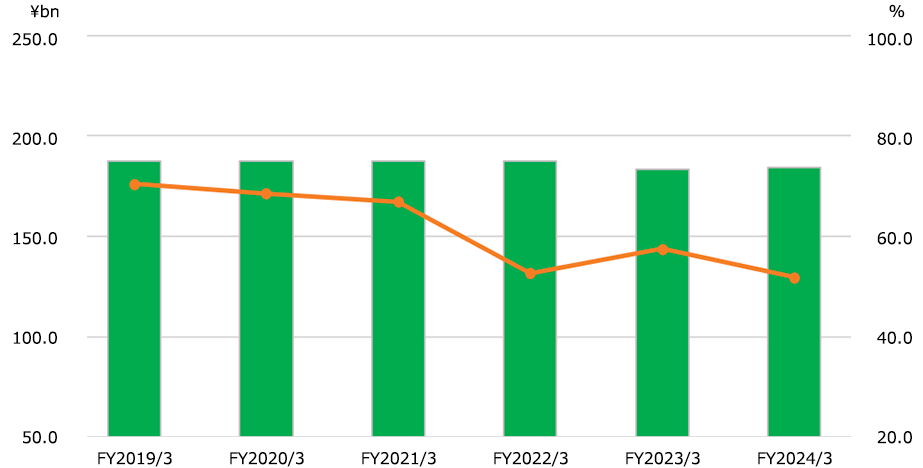
| FY2020/3 | FY2021/3 | FY2022/3 | FY2023/3 | FY2024/3 | FY2025/3 | |
|---|---|---|---|---|---|---|
Total dividend payment |
187.4 | 187.4 | 187.4 | 183.4 | 184.4 | 208.8 |
Dividend payout ratio(%) |
68.5 | 66.9 | 52.7 | 57.5 | 51.8 | 50.6 |
(Quarterly)
Results of OperationsConsolidated
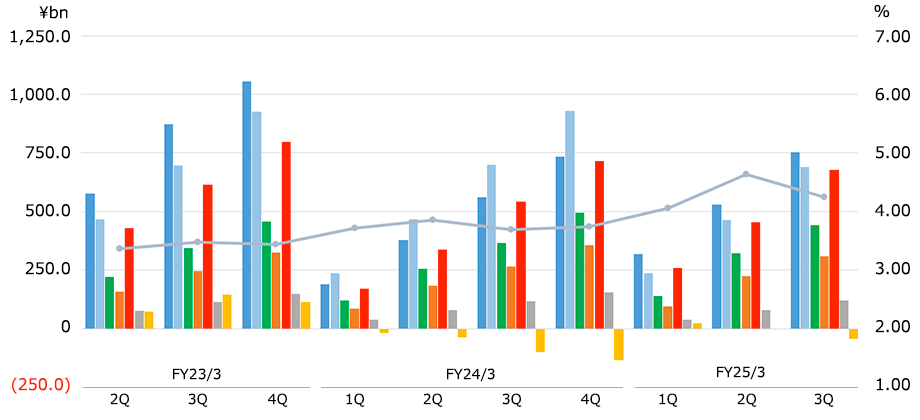
| FY24/3 | FY25/3 | FY26/3 | ||||||||
|---|---|---|---|---|---|---|---|---|---|---|
| 1Q | 2Q | 3Q | 4Q | 1Q | 2Q | 3Q | 4Q | 1Q | 2Q | |
Consolidated gross operating profit |
189.3 | 377.7 | 560.9 | 733.6 | 319.0 | 528.4 | 753.9 | 1,045.6 | 262.9 | 618.9 |
General and administrative expenses* |
237.3 | 467.6 | 700.4 | 929.1 | 238.0 | 464.3 | 690.6 | 915.6 | 240.7 | 475.7 |
Net ordinary income |
118.4 | 253.8 | 367.0 | 496.0 | 137.7 | 321.4 | 441.2 | 584.5 | 153.8 | 354.0 |
Net income attributable to owners of parent |
86.8 | 182.1 | 263.3 | 356.1 | 96.2 | 222.8 | 308.3 | 414.3 | 104.8 | 240.3 |
Net interest income |
169.1 | 337.9 | 542.2 | 715.7 | 258.6 | 452.6 | 676.2 | 956.7 | 232.2 | 567.0 |
Net fees and commissions |
38.6 | 77.5 | 118.0 | 153.0 | 39.3 | 78.7 | 120.0 | 156.3 | 41.1 | 84.0 |
Net other operating income (loss) |
(18.4) | (37.7) | (99.3) | (135.1) | 20.9 | (2.9) | (42.3) | (67.4) | (10.4) | (32.1) |
ROE (based on shareholders’ equity)(%)** |
3.71 | 3.85 | 3.69 | 3.74 | 4.05 | 4.63 | 4.24 | 4.28 | 4.33 | 4.90 |
* General and administrative expenses exclude non-recurring losses.
** ROE = net income attributable to owners of parent / [(sum of total net assets at the beginning and the end of the period) / 2] x 100
Breakdown of Net Fees and CommissionsNon-consolidated
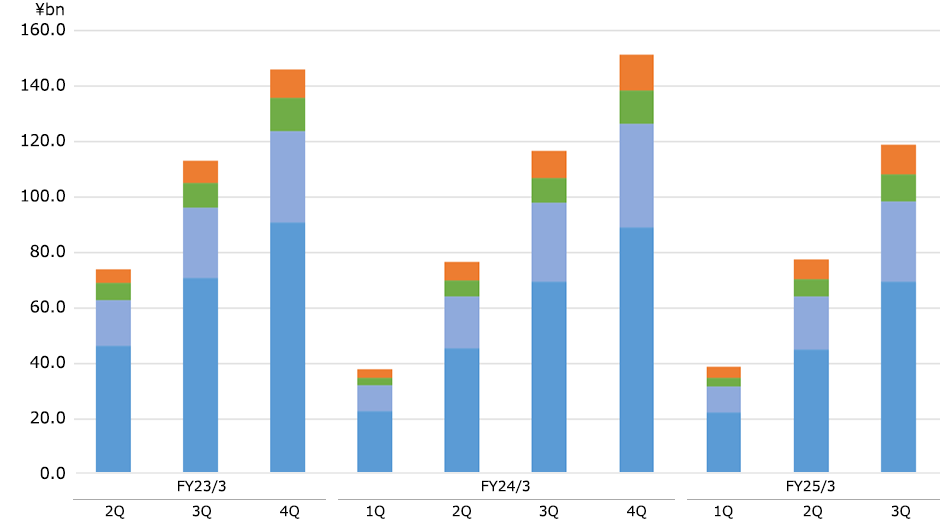
| FY24/3 | FY25/3 | FY26/3 | ||||||||
|---|---|---|---|---|---|---|---|---|---|---|
| 1Q | 2Q | 3Q | 4Q | 1Q | 2Q | 3Q | 4Q | 1Q | 2Q | |
Others |
3.3 | 6.6 | 10.0 | 12.7 | 3.9 | 7.2 | 10.7 | 13.8 | 3.8 | 7.4 |
Investment trusts* |
2.9 | 5.9 | 8.9 | 12.2 | 3.2 | 6.4 | 9.7 | 13.0 | 3.1 | 6.4 |
ATMs |
9.1 | 18.6 | 28.3 | 37.3 | 9.6 | 19.3 | 29.0 | 38.1 | 9.6 | 19.2 |
Exchange and settlement transactions |
22.9 | 45.5 | 69.7 | 89.2 | 22.3 | 44.9 | 69.4 | 89.8 | 24.2 | 50.1 |
* Investment trusts include Yucho Fund Wraps (discretionary investment contract services).
Financial ConditionsNon-consolidated
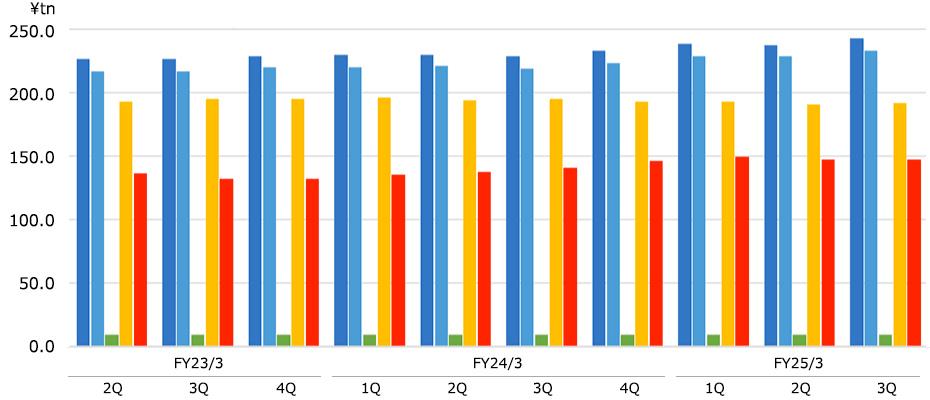
| FY24/3 | FY25/3 | FY26/3 | ||||||||
|---|---|---|---|---|---|---|---|---|---|---|
| 1Q | 2Q | 3Q | 4Q | 1Q | 2Q | 3Q | 4Q | 1Q | 2Q | |
Total assets |
229.7 | 230.3 | 229.1 | 233.8 | 238.6 | 238.2 | 243.1 | 233.5 | 230.9 | 232.8 |
Total liabilities |
220.0 | 221.3 | 219.5 | 224.1 | 229.4 | 228.7 | 233.8 | 224.5 | 221.9 | 223.6 |
Total net assets |
9.6 | 9.0 | 9.5 | 9.6 | 9.2 | 9.5 | 9.3 | 9.0 | 8.9 | 9.2 |
Deposits |
196.0 | 194.1 | 194.9 | 192.8 | 193.3 | 191.3 | 192.1 | 190.4 | 190.9 | 188.4 |
Securities |
135.2 | 137.7 | 141.4 | 146.4 | 149.8 | 147.6 | 147.7 | 143.5 | 143.9 | 144.2 |
Asset Management StatusNon-consolidated
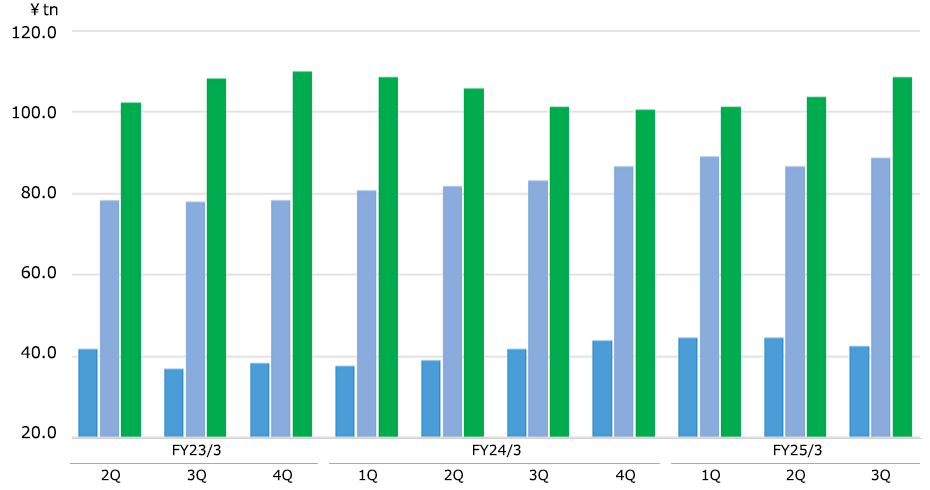
| FY24/3 | FY25/3 | FY26/3 | ||||||||
|---|---|---|---|---|---|---|---|---|---|---|
| 1Q | 2Q | 3Q | 4Q | 1Q | 2Q | 3Q | 4Q | 1Q | 2Q | |
Japanese government bonds |
37.6 | 38.9 | 41.6 | 43.8 | 44.7 | 44.7 | 42.6 | 40.3 | 40.8 | 40.5 |
Foreign securities, etc. |
80.6 | 81.8 | 83.3 | 86.6 | 89.2 | 86.8 | 88.9 | 87.4 | 87.3 | 87.8 |
Others |
108.5 | 106.0 | 101.3 | 100.5 | 101.4 | 103.9 | 108.6 | 102.4 | 99.7 | 101.4 |
Capital Adequacy RatioConsolidated
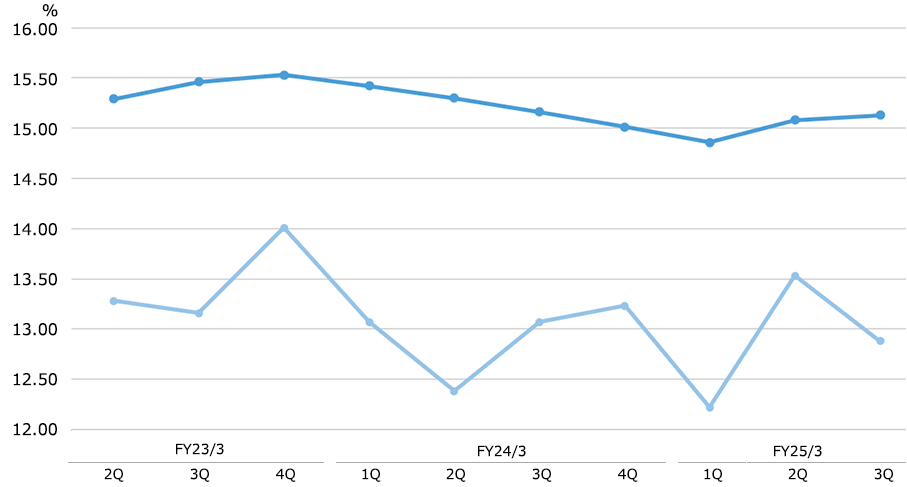
| FY24/3 | FY25/3 | FY26/3 | ||||||||
|---|---|---|---|---|---|---|---|---|---|---|
| 1Q | 2Q | 3Q | 4Q | 1Q | 2Q | 3Q | 4Q | 1Q | 2Q | |
Capital adequacy ratio (Domestic standard)* |
15.42 | 15.30 | 15.16 | 15.01 | 14.86 | 15.08 | 15.13 | 15.08 | 15.48 | 15.67 |
CET1 ratio (International standard)** |
13.07 | 12.38 | 13.07 | 13.23 | 12.22 | 13.53 | 12.88 | 11.77 | 12.16 | 12.43 |
* Since FY25/3 4Q, the figure is on the finalized Basel Ⅲ basis.
** Excluding unrealized gains on available-for-sale securities. Calculation for some items in the CET1 ratio are simplified. Since FY24/3 4Q, the CET1 ratios are on the finalized Basel Ⅲ basis.
(Earnings and Dividends Forecasts)
Earnings ForecastsConsolidated
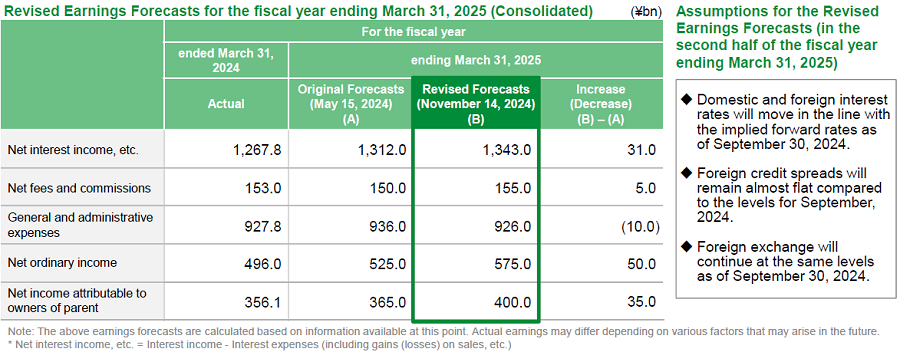
- ■For earnings forecasts for the fiscal year ending March 31, 2026, net ordinary income and net income attributable to owners of parent are expected to amount to ¥680.0 bn and ¥470.0 bn, respectively. We aim to achieve record high profits in our history as a listed company for the third consecutive fiscal year.
- ■In the fiscal year ending March 31, 2026, the forecasts see an increase in income compared to the fiscal year ended March 31, 2025, mainly due to an increase in income from new investments in JGBs with a rise in domestic interest rates, while gains on sales of stocks associated with operation for risk controls are projected to decrease and general and administrative expenses are projected to increase.
Dividends ForecastConsolidated
- ■Dividend per share for the fiscal year ended March 31, 2025 is ¥58, an increase of ¥2 from the revised-upward dividend forecast announced on November 14, 2024.
- ■Dividend per share for the fiscal year ending March 31, 2026, taking into consideration the earnings forecasts and the shareholder return policy during the Medium-term Management Plan (FY2022/3 through FY2026/3), is planned to be ¥66, an increase of ¥8 from the fiscal year ended March 31, 2025(dividend payout ratio of 50.2%).
